Wave Trend Oscillator (WTO) Indicator MT4 MetaTrader for scalp in Forex Free Download

Introduction to Wave Trend Oscillator (WTO) Indicator for Stock Market and Forex 📉📈
The Wave Trend Oscillator (WTO) indicator is an important tool for technical analysis in financial markets such as Forex and the Stock Market. It is available for MetaTrader 4 and falls under the category of oscillators. Its main function is to detect market trends and analyze the market’s power and volume. With this indicator, you can identify both bullish and bearish trends and fine-tune your trades more accurately.
The WTO indicator works based on wave analysis and not only identifies the market trend but also shows its strength. This tool allows you to enter trades at the right time and receive more accurate buy and sell signals.
Premium TradingView account only $20 to buy, click here.
Click here to download and install the WTO Indicator .
How to Install the Wave Trend Oscillator Indicator in MetaTrader 4 🖥️
To install the WTO indicator in MetaTrader 4, follow these steps:
- Download the Indicator: Download the WTO indicator file from the provided link on the download page.
- Transfer to MT4 Directory: Move the indicator file to the
Indicatorsfolder in your MT4 installation directory. - Restart MetaTrader: After transferring, restart the MetaTrader software.
- Add the Indicator to Your Chart: After restarting, add the WTO indicator to your chart from the “Navigator” section.
You can watch the installation and settings tutorial videos at the end of this post for easy installation.
WTO Indicator Settings 🔧 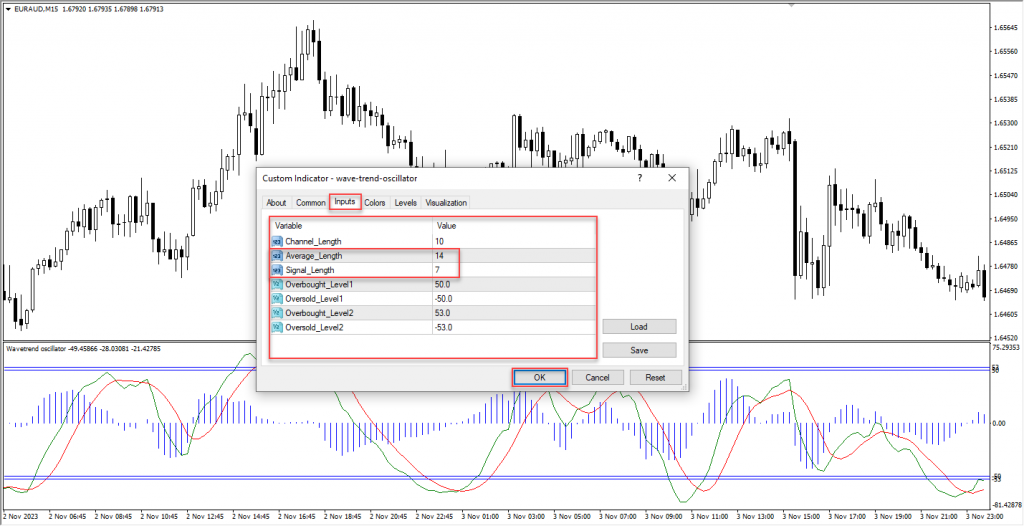
Click here to download and install the WTO Indicator .
To set up the WTO indicator, go to its settings section and input the following values:
- Average Length: Set this option to 14.
- Signal Length: Set this option to 7.
These settings are for the specific chart and timeframe you’re working with. For each new chart or timeframe, change the settings of the indicator according to your needs.
How to Identify Market Trend Changes with the WTO Indicator 🔄

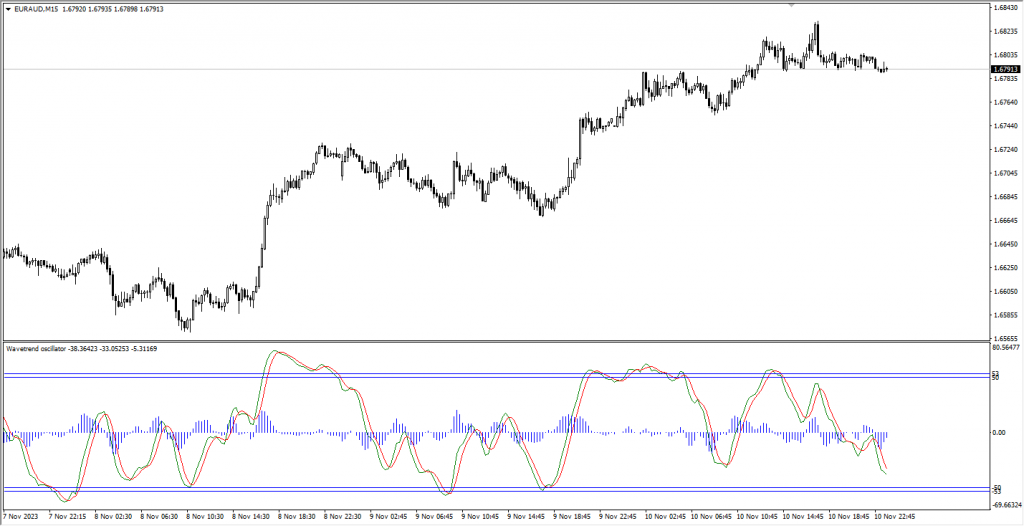
The WTO indicator can effectively identify market trend changes. It includes two lines: Average and Signal, which represent the overall market trend. Additionally, the histogram displays the market volume and the strength of buyers and sellers.
- Bullish Trend: When buyers’ strength exceeds that of sellers, both the Average and Signal lines move towards the positive.
- Bearish Trend: When sellers’ strength exceeds that of buyers, both the Average and Signal lines move towards the negative.
Buy Signal Using WTO Indicator 🔼

Click here to download and install the WTO Indicator .
To identify a buy signal, follow these steps:
- Detect Buyer Strength: When the strength of buyers exceeds sellers, the histogram bars start to reduce in height and cross the zero line upwards.
- Crossing of Two Lines: After the histogram bars cross upwards, both the Average (red) and Signal (green) lines cross each other from below to above.
- Bullish Candle Formation: At this point, a bullish or confirmation candle forms, indicating a trend change to bullish.
- Enter Buy Position: After observing the confirmation candle, enter a buy position at the Close price of the candle.
- Stop Loss: To set the stop-loss, you can use the previous swing of the candle or the previous trough near the buy signal. Alternatively, to reduce risk, you can use the ATR to set the stop-loss point.
Sell Signal Using WTO Indicator 🔽

Click here to download and install the WTO Indicator .
To identify a sell signal, follow these steps:
- Detect Seller Strength: When the strength of sellers exceeds buyers, the histogram bars start to reduce in height and cross the zero line downwards.
- Crossing of Two Lines: After the histogram bars cross downwards, both the Average (red) and Signal (green) lines cross each other from above to below.
- Bearish Candle Formation: At this point, a bearish or confirmation candle forms, indicating a trend change to bearish.
- Enter Sell Position: After observing the confirmation candle, enter a sell position at the Close price of the candle.
- Stop Loss: To set the stop-loss, you can use the previous swing of the candle or the previous peak near the sell signal. Alternatively, to reduce risk, you can use the ATR to set the stop-loss point.
Exiting a Position and Risk Management ⚖️

Managing risk and exiting positions are very important. To exit buy or sell positions, you can use two methods:
- Risk-Reward Ratio Management: You can set the risk-reward ratio between 1.5 to 2, meaning for every 1 unit of risk, aim for at least 1.5 to 2 units of reward.
- Trend Change: If the market trend changes and you see the first bearish or bullish candle, you can exit your position.
Other Uses of the Wave Trend Oscillator Indicator ⚙️

The WTO indicator works well on all timeframes, making it suitable for traders with various strategies. By analyzing the market’s status, it provides more accurate signals and helps you make better decisions in Forex and stock markets.
Additionally, this indicator effectively identifies the strength of buyers and sellers, helping you enter and exit the market at the right times.
The Wave Trend Oscillator is one of the essential tools in technical analysis for financial markets like Forex and the Stock Market. Using wave analysis, the strength of buyers and sellers, and histogram bars, it provides accurate buy and sell signals. By using this indicator, you can identify the market trend and make better decisions when entering and exiting trades.
This indicator works well across all timeframes and can help you enter trades with more precision. With the right settings and identifying the correct signals, you can manage risk and maximize profitability in financial markets.


Post Comment