VZO Signal Indicator MT4 MetaTrader for scalp in Forex Free Download

📊 Introducing the VZO Signal Indicator for MetaTrader 4
The VZO Signal MT4 indicator is one of the practical technical analysis tools in the Forex market, specifically designed for the MetaTrader 4 (MT4) trading platform. This indicator combines the Volume Zone Oscillator (VZO) with a moving average to help traders accurately identify market trends and receive more precise buy and sell signals.
This analytical tool is displayed in a separate window below the chart and consists of two lines:
Premium TradingView account only $20 to buy, click here.
- The VZO line, which appears in green and red
- The blue Signal line, which acts as the signal line

Click here to download and install VZO Signal Indicator.
🔁 How the VZO Signal Indicator Works
The VZO indicator is categorized as an oscillator, meaning it moves within a specific range and indicates overbought and oversold zones. This indicator has two oscillating lines that move within the +40 to -40 range:
- Green VZO line indicates buyer strength and an upward trend.
- Red VZO line reflects seller strength and a downward trend.
The blue line, called Signal, is a moving average that serves as a guide for trend changes. Whenever the VZO line crosses the Signal line from below and its color changes from red to green, it indicates the start of an upward trend. Conversely, if it crosses the Signal line from above and changes color from green to red, it signals the beginning of a downward trend.
📉 Identifying Overbought and Oversold Zones
There are two key levels in this indicator that require special attention:
- +40 = Overbought zone
- -40 = Oversold zone
When the price is in these zones and signs of a trend reversal appear, the validity of the generated signals increases. That’s why it’s recommended to always consider these levels in your analyses.
⚠️ Important Note Before Entering a Trade
Remember: No indicator alone can make a definitive trading decision. Be sure to validate the signals generated by the VZO using other tools such as RSI, MACD, price action, or candlestick structures. Combining indicators into a coherent strategy will increase your efficiency.
🛠️ How to Install the Indicator in MetaTrader 4

Click here to download and install VZO Signal Indicator.
To install the VZO indicator in MetaTrader 4, follow these steps:
- Download the indicator file from the download section.
- Open MetaTrader 4, go to the top menu, select File > Open Data Folder.
- Navigate to MQL4 > Indicators and place the indicator file in this folder.
- Close and reopen MetaTrader.
- Drag the indicator from the Navigator window onto the chart.
- In the opened window, enable Allow DLL imports and click OK.
⚙️ Technical Settings of the VZO Signal MT4 Indicator

Click here to download and install VZO Signal Indicator.
In the indicator settings section (Inputs tab), you can modify parameters such as the moving average period, signal sensitivity, and oscillation range according to your trading strategy.
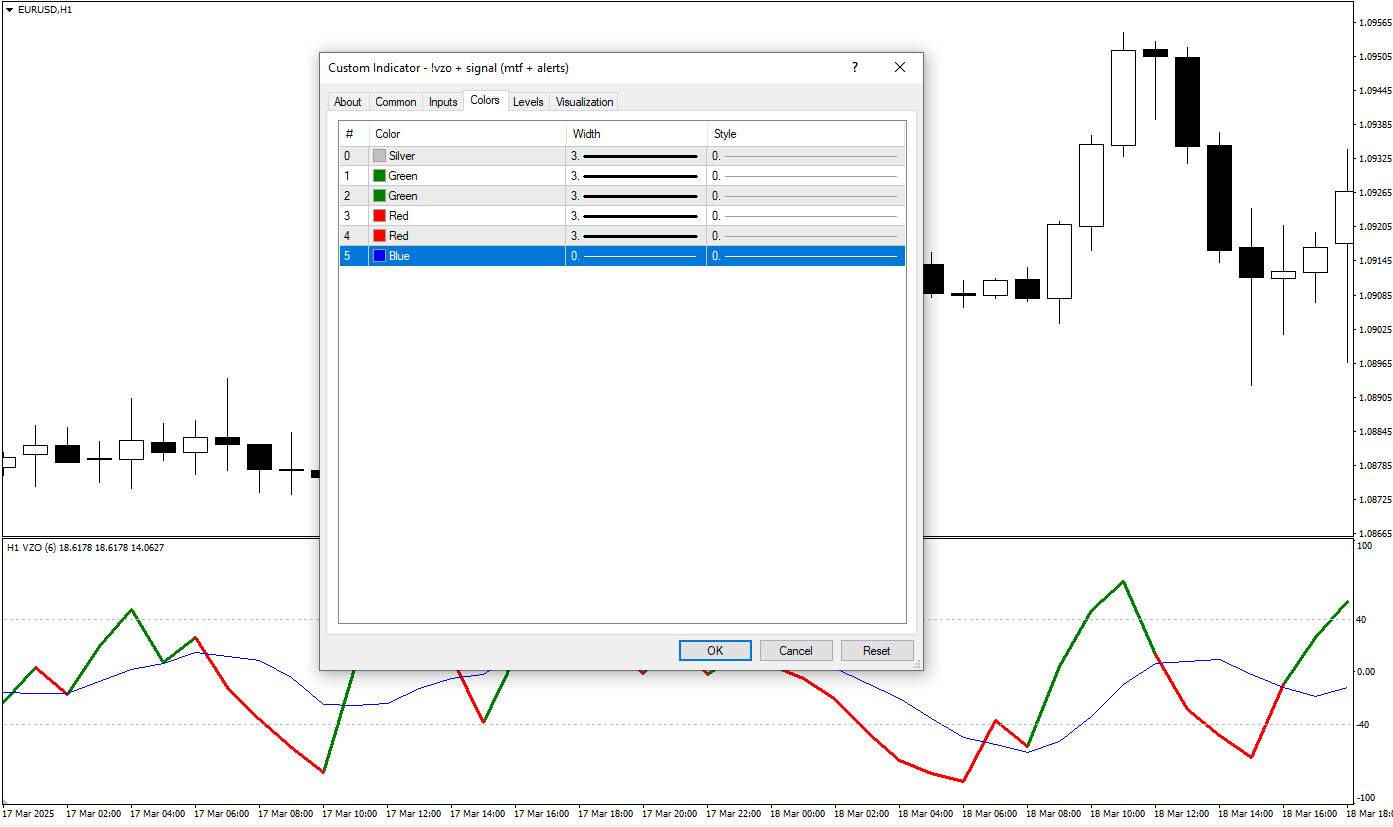
In the Colors tab, you can also customize the line colors to match your chart background and visual preferences.
Click here to download and install VZO Signal Indicator.
📈 Buy Signal Using the VZO Indicator

📌 Conditions for Entering a Buy Trade:
- The blue line (Signal) is the moving average line.
- The VZO line changes color from red to green.
- VZO crosses the Signal line from below in the oversold area (below 0 or -40).
This condition indicates a trend reversal toward an uptrend and generates a buy signal. Be sure to confirm this signal using other tools. After observing a confirmed bullish candlestick, enter a Buy position. Set your Stop Loss based on your strategy.
📌 Conditions for Exiting a Buy Trade:
When the VZO line touches the Signal line and changes color from green to red, it’s a good time to exit the buy position.
📉 Sell Signal Using the VZO Indicator
Click here to download and install VZO Signal Indicator.
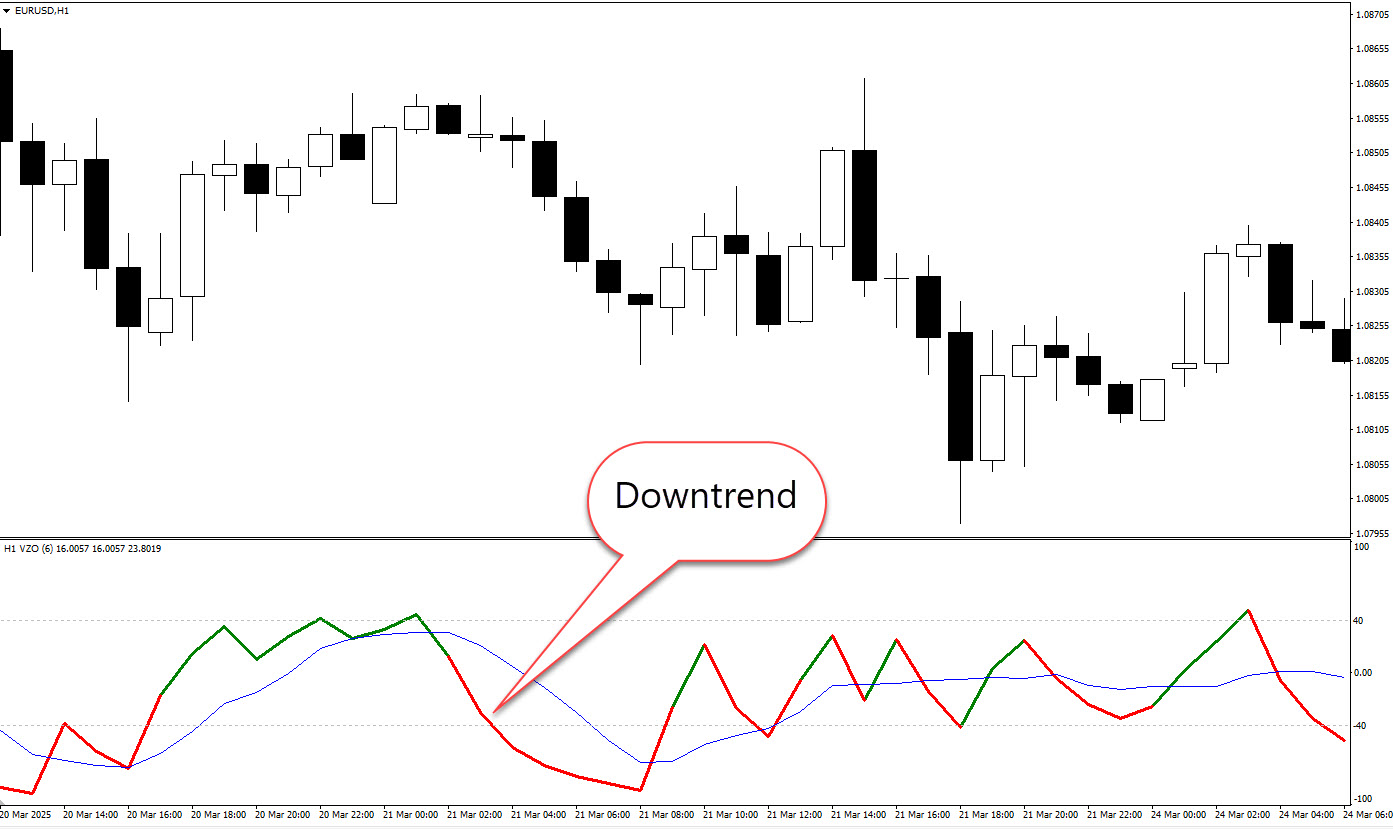
📌 Conditions for Entering a Sell Trade:
- The VZO line changes color from green to red.
- VZO crosses the Signal line from above in the overbought area (above 0 or near +40).
This condition signals the beginning of a downtrend. Always seek confirmation from other indicators. After observing a confirmed bearish candlestick, enter a Sell position. Set the Stop Loss appropriately.
📌 Conditions for Exiting a Sell Trade:
When the VZO line crosses the Signal line again and changes color from red to green, exit the sell position.

Click here to download and install VZO Signal Indicator.
💼 Benefits of Using the VZO Signal MT4 Indicator
✅ Easy to use for all traders, even beginners
✅ High customizability with various settings
✅ Clear signals with color-coded alerts
✅ Clear display of market trend and overbought/oversold zones
✅ Suitable for different timeframes and strategies
✅ Can be combined with other indicators for a personalized strategy
The VZO Signal indicator is a useful tool for identifying trends and optimal entry and exit points in the Forex market. As a dual-line oscillator, it simplifies trend analysis and generates clear, color-coded signals. But never forget: success in Forex does not depend on indicators alone! Experience, personal analysis, capital management, and smart use of supporting tools all play a key role in achieving sustainable profit.


Post Comment