the Trendlines Indicator MT4 MetaTrader for scalp in Forex Free Download
Introduction to the Trendlines Indicator for Stocks and Forex (15-Minute Timeframe) 📉📊
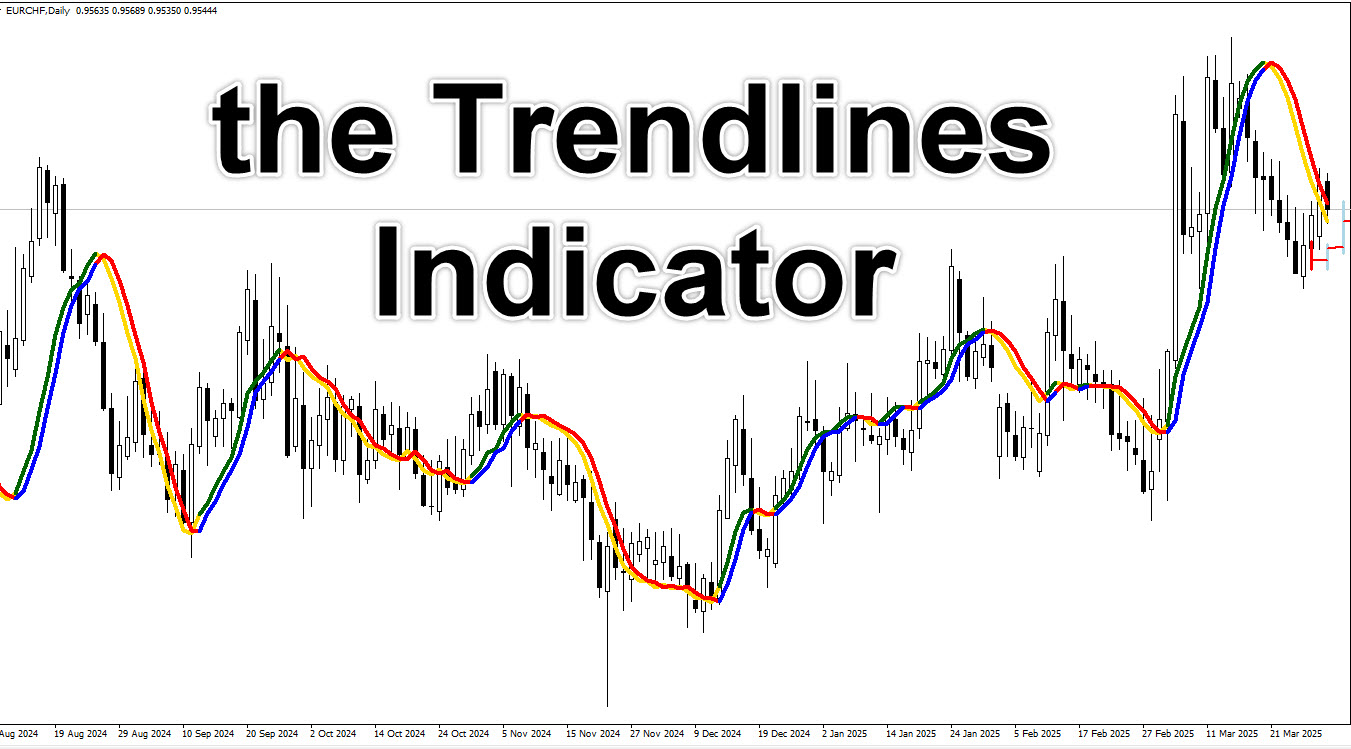
The Trendlines indicator is an extremely useful tool for trading in the Forex market. This indicator draws trendlines on the chart and identifies market fluctuations. Since the indicator consists of two trendlines that cross each other to generate buy and sell signals, traders can use it to make precise decisions for entering and exiting the market. This indicator can be useful in all timeframes, but for optimal performance, its settings should be customized based on your selected timeframe and chart.

Premium TradingView account only $20 to buy, click here.
Click here to download and install the Trendlines Indicator .
Installing the Trendlines Indicator in MetaTrader 4 ⚙️
To use the Trendlines indicator in MetaTrader 4, you first need to install the indicator. At the end of this post, there is a tutorial video that explains how to install this indicator in MetaTrader 4. By watching the video, you can easily install the indicator. During the installation process, just move the indicator files to the appropriate folder in MetaTrader 4 and add it to your chart through the Navigator section.
Settings for the Trendlines Indicator in MetaTrader 4 🔧

After installing the indicator, adjust its settings according to your chosen timeframe and chart. In the Inputs tab, there are two adjustable options. Set the LSMA-Period value to 14 and click OK. In the Color tab, you can change the appearance of the trendlines. For example, set the first color to yellow and the second color to green. After making these changes, click OK to save the settings.
Buy Signal Using the Trendlines Indicator 💹

Click here to download and install the Trendlines Indicator .
When to Enter a Buy Position:
A buy signal is generated when the trendlines change direction and move upwards. This indicator has two trendlines: one red and blue, and the other yellow and green. If the market trend is upward, the first trendline turns green, and the second trendline turns blue, signaling a buy.
Exact Conditions for Entering a Buy Position:
- When the green trendline crosses the blue trendline from below and is positioned above it, a buy signal is generated.
- Enter the buy position using a strong bullish candle or a consolidation candle at the crossover point.
- It is better to enter a buy position when the direction of both trendlines is upwards. If the crossover happens at a point where the trendlines are heading downwards, the signal is less reliable.
- You can place the stop-loss at the previous swing point or use the ATR indicator to precisely determine the stop point.
When to Exit a Buy Position:
To exit the buy position, you can set your risk and adjust the reward ratio to 1 to 1.5. Additionally, you can exit the position when you notice a crossover of the trendline.
Sell Signal Using the Trendlines Indicator 💸

Click here to download and install the Trendlines Indicator .
When to Enter a Sell Position:
When the selling power increases, the trendlines change direction and move downwards. As with the buy signal, this indicator has two trendlines: one red and blue, and the other yellow and green. In a downtrend, the first trendline turns yellow, and the second trendline turns red, signaling a sell.
Exact Conditions for Entering a Sell Position:
- When the yellow trendline crosses the red trendline from above and is positioned below it, a sell signal is generated.
- Enter the sell position using a strong bearish candle or a consolidation candle at the crossover point.
- It is better to enter a sell position when the direction of both trendlines is downwards. If the crossover happens at a point where the trendlines are heading upwards, the signal is less reliable.
- You can place the stop-loss at the previous swing point or use the ATR indicator to precisely determine the stop point.
When to Exit a Sell Position:
To exit the sell position, use your risk settings and adjust the reward ratio to 1 to 1.5. You can also exit the position when you notice a crossover of the trendline.
The Trendlines indicator is one of the best tools for identifying market trends, helping traders recognize market fluctuations by drawing trendlines on the chart. In addition to displaying the market trend, this indicator also provides buy and sell signals. The color crossover and interaction between the two trendlines show buy or sell entry points. To use this indicator optimally, it’s important to understand the signal conditions and adjust its settings according to your selected timeframe. This indicator is a valuable tool for professional traders looking for precise market trend identification.
Click here to download and install the Trendlines Indicator .


Post Comment