the Four Period RSI Arrows Indicator MT4 MetaTrader for scalp in Forex Free Download
Introduction to the Four Period RSI Arrows Indicator 📉📈
The RSI (Relative Strength Index) is one of the most popular tools in technical analysis, mainly used to identify overbought and oversold points in the market. This indicator helps traders identify potential market reversals. However, the Four Period RSI Arrows indicator is an advanced version with additional features. It is based on the RSI concept but enhances its functionality by utilizing multiple timeframes to detect market movements and trends.
What is the Four Period RSI Arrows Indicator? 🤔

Premium TradingView account only $20 to buy, click here.
Click here to download and install The Four Period RSI Arrows Indicator .
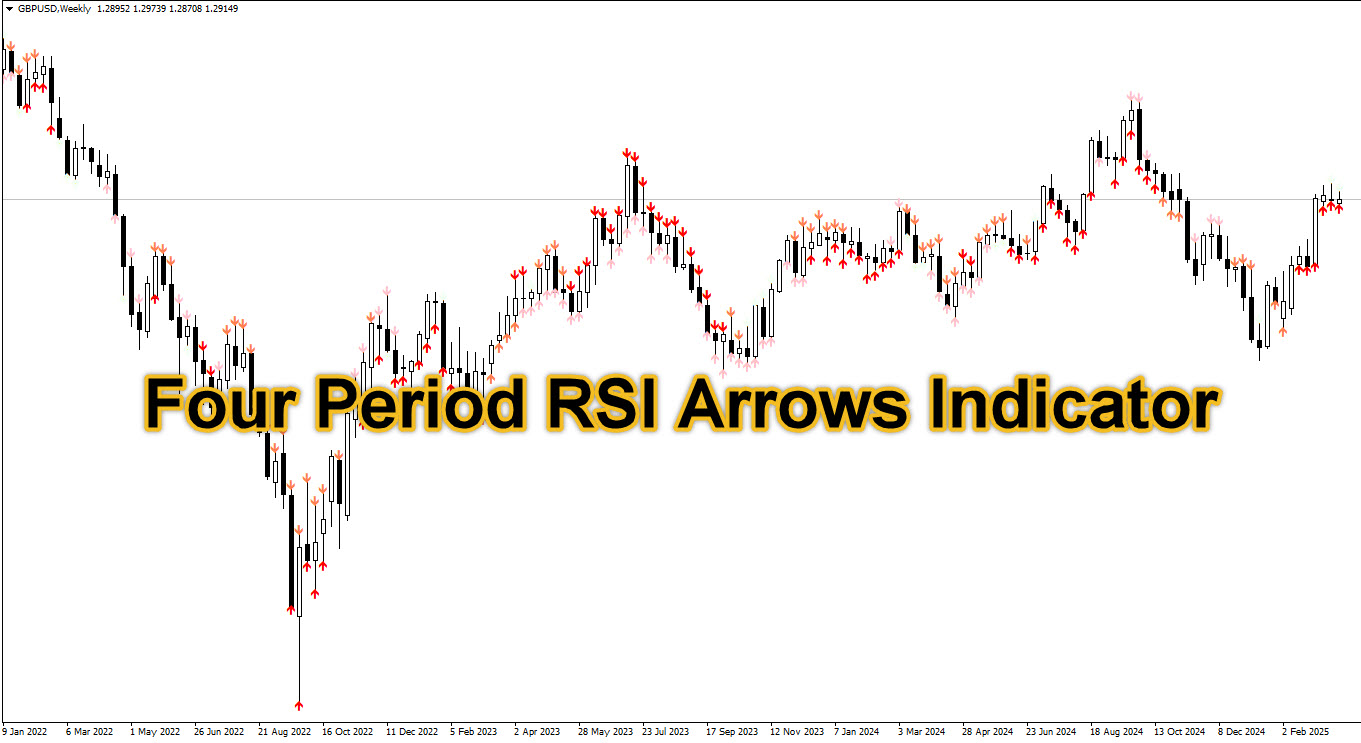
The Four Period RSI Arrows is a technical indicator that uses the RSI to determine market direction by analyzing data across multiple timeframes. The indicator draws arrows on the chart that indicate the market’s movement direction. These arrows are shown in different colors, each representing a specific timeframe. The arrows clearly indicate the market’s direction, helping traders make more accurate buying and selling decisions.
How Does the Four Period RSI Arrows Indicator Work? 💡

This indicator specifically operates based on RSI and its values across four different timeframes. It has two key levels for identifying overbought and oversold conditions: Level 38 and Level 62. When the RSI falls below 38, it indicates oversold conditions, signaling a downward movement, and the indicator draws a downward arrow. Conversely, when the RSI rises above 62, it signals an upward movement, and the indicator draws an upward arrow.
The algorithm of this indicator processes data in four timeframes chosen by the user. This feature helps traders simulate various market trends across different timeframes and capitalize on them.
Settings for the Four Period RSI Arrows Indicator on MT4 ⚙️

Click here to download and install The Four Period RSI Arrows Indicator .
The Four Period RSI Arrows indicator comes with several customizable settings that traders can adjust to suit their needs. These settings allow the use of different timeframes and periods for analyzing market trends.
- atf, btf, ctf, dft: These options refer to the timeframes in which the indicator’s algorithm is executed. These settings should be adjusted based on minutes.
- first_RSIperiods, second_RSIperiods, third_RSIperiods, fourth_RSIperiods: These options specify the number of RSI periods applied in each timeframe.
- rsi_applied_price: This option defines which price (open, close, high, or low) is used to calculate the RSI.
- shift: This option allows users to shift the RSI value forward or backward.
- rsiUpperTrigger and rsiLowerTrigger: These options define the upper and lower thresholds that the indicator uses to determine market direction.
Buy Signal Using the Four Period RSI Arrows Indicator 📈

To identify buy signals, traders should pay attention to the color and direction of the indicator’s arrows.
When to Enter a Buy Trade:
When the arrows across multiple timeframes point upwards, it signals an upward market movement, indicating a good time to buy.
When to Exit a Buy Trade:
If the arrows change direction to point downward and darken, it signals a trend reversal to a downward movement, and traders should exit the buy trade.
Sell Signal Using the Four Period RSI Arrows Indicator 📉

Click here to download and install The Four Period RSI Arrows Indicator .
The Four Period RSI Arrows indicator is also useful for identifying the right time to sell.
When to Enter a Sell Trade:
If the arrows across multiple timeframes point downward, it indicates a downward market movement, suggesting the right time to enter a sell trade.
When to Exit a Sell Trade:
If the arrows point upwards and darken, it signals a trend reversal to an upward movement, and traders should exit the sell trade.
The Four Period RSI Arrows indicator is a valuable tool for identifying market trends using RSI across four different timeframes. It helps traders simulate market trends more accurately with colored directional arrows, enabling them to find the best times to buy and sell. Using this indicator, traders can enter the market with greater confidence and take advantage of trend changes.


Post Comment