The 3_Level_ZZ_Semafor Indicator MT5 MetaTrader for scalp in Forex Free Download

3_Level_ZZ_Semafor: A Powerful Tool for Stock and Forex Market Analysis 📊
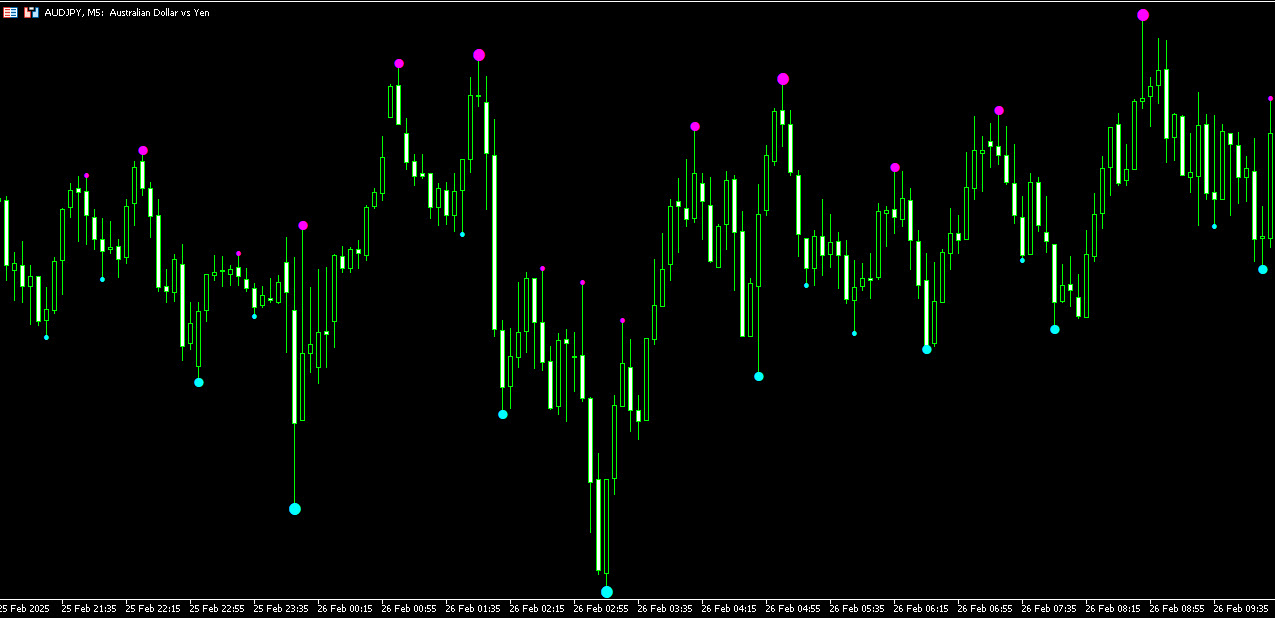
The 3_Level_ZZ_Semafor indicator is a simple yet precise tool for identifying the start and end of long-term, medium-term, and short-term periods in financial markets such as stocks and forex. This indicator visually displays price changes using colored circular points, helping analysts better understand bullish and bearish market trends. The indicator was released on 01/09/2008 and has since gained the attention of many traders.
Premium TradingView account only $20 to buy, click here.
Click here to download and install the3_Level_ZZ_Semafor Indicator
How the 3_Level_ZZ_Semafor Indicator Works 🔄
This indicator operates based on the ZigZag algorithm, which is part of the standard MetaTrader client terminal. ZigZag is a technical analysis tool that identifies price reversal points on a chart. The 3_Level_ZZ_Semafor indicator uses this algorithm to place colored circles at the peaks and troughs of the chart, thereby indicating the start and end of different trends.
Displaying Trend Strength with Colored Circles 🔴🔵
One of the appealing features of this indicator is its use of circle size to display trend strength:
- Blue Circles: Represent bullish trends. The larger the blue circle, the stronger the upward trend.
- Pink Circles: Represent bearish trends. The larger the pink circle, the stronger the downward trend.
This feature helps analysts quickly assess trend strength and make better trading decisions.
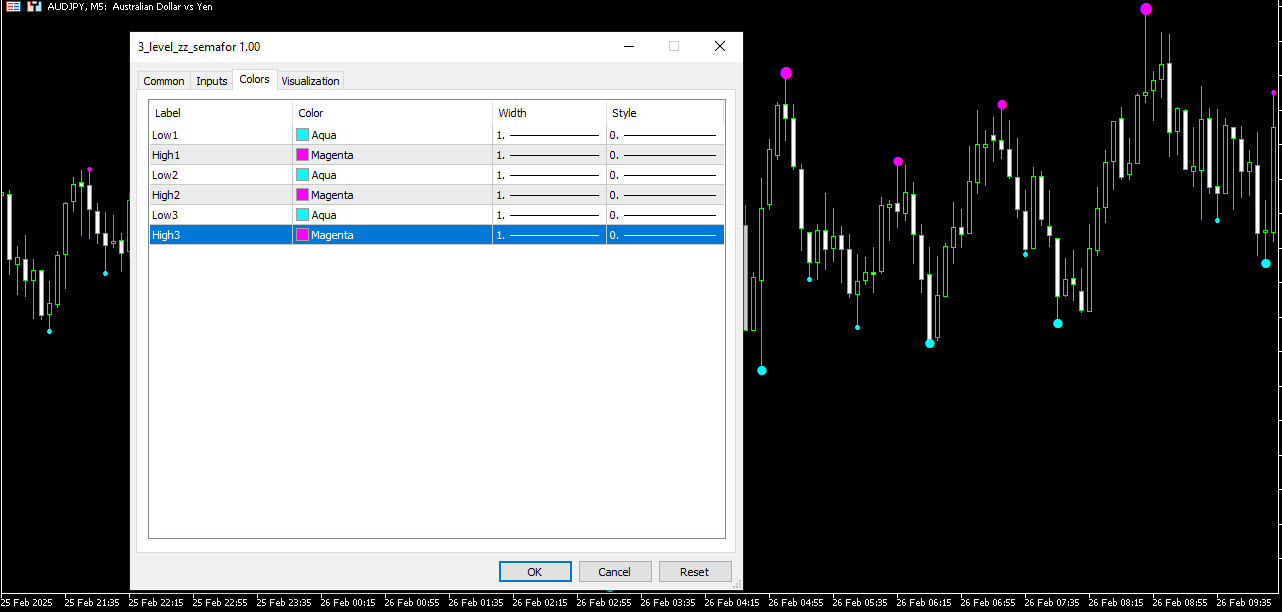
3_Level_ZZ_Semafor Indicator Settings ⚙️
This indicator works well with its default settings, but analysts can adjust the settings according to their needs. Below, we review the main settings of this indicator.

Click here to download and install the3_Level_ZZ_Semafor Indicator
Basic Settings 📏
- Period1=5;: First period (short-term)
- Period2=13;: Second period (medium-term)
- Period3=34;: Third period (long-term)
If you want to deactivate one of the periods, set its value to 0.
Deviation and Step Settings (Dev_Step) 🔧
The deviation and step for each period are separated by commas. These settings are similar to the simple ZigZag settings:
- Dev_Step_1=”1,3″;: Settings for the first period
- Dev_Step_2=”8,5″;: Settings for the second period
- Dev_Step_3=”21,12″;: Settings for the third period
Changing Circle Shapes 🎨
The shape of the circles for each period can be changed using the following codes:
- Symbol_1_Kod=140;: Circle shape code for the first period
- Symbol_2_Kod=141;: Circle shape code for the second period
- Symbol_3_Kod=142;: Circle shape code for the third period
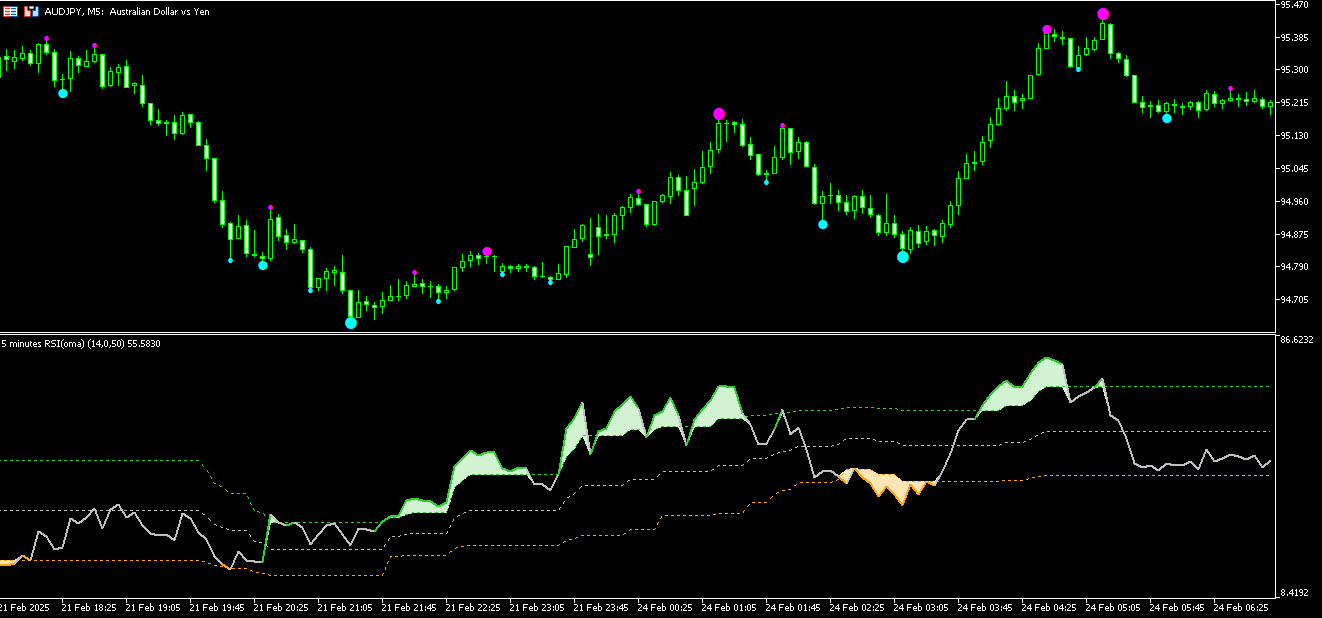
How to Generate Signals from the 3_Level_ZZ_Semafor Indicator 📈📉

Click here to download and install the3_Level_ZZ_Semafor Indicator
This indicator visually displays buy and sell signals. Below, we explain how to use these signals.
Buy Signal
- When blue circles appear on the chart, it indicates the start of a bullish trend.
- The larger the blue circles, the stronger the upward trend.
- Analysts can identify suitable buy positions by observing these circles.
Sell Signal
- When pink circles appear on the chart, it indicates the start of a bearish trend.
- The larger the pink circles, the stronger the downward trend.
- Analysts can identify suitable sell positions by observing these circles.
Advantages of Using the 3_Level_ZZ_Semafor Indicator 🌟

- Simplicity and Accuracy: Despite its simplicity, this indicator is highly accurate.
- Visual Display: The use of colored circles allows for quick and visual trend analysis.
- Customizability: Analysts can adjust the indicator settings according to their needs.
- Applicability in Various Markets: This indicator performs well in both stock and forex markets.
Important Notes When Using the 3_Level_ZZ_Semafor Indicator ⚠️
- Strategy Testing: Before using this indicator in real trading, be sure to test it on demo accounts.
- Combining with Other Tools: To increase analysis accuracy, it is better to combine this indicator with other technical analysis tools.
- Risk Management: Always use proper risk management in your trades.
The 3_Level_ZZ_Semafor indicator is a powerful and simple tool for analyzing market trends. Using this indicator, analysts can quickly identify the start and end of bullish and bearish trends and make better trading decisions. With its customizable features, this indicator can be used as part of your trading strategy.


Post Comment