MACD2 Indicator MT5 MetaTrader for scalp in Forex Free Download.
The MACD2 MT5 indicator is a very good and practical tool for technical analysis in the Forex market, available on the MetaTrader 5 platform. This indicator is essentially an improved and customizable version of the original MACD (Moving Average Convergence Divergence) indicator, offering more features for analyzing trends, trading strength, and identifying entry and exit points in the market. Using this indicator on the 30-minute timeframe can help traders identify short-term price movements more accurately and seize profitable trading opportunities.The MACD2 indicator is a type of oscillator that is calculated based on the convergence and divergence of price moving averages. This indicator provides crucial information about trend direction, trend strength, and the likelihood of trend changes in the market. By visually displaying trend changes through histograms, signal lines, and the MACD line, MACD2 helps traders easily recognize price patterns and make better trading decisions.

Premium TradingView account only $20 to buy, click here.
Click here to download and install MACD2 Indicator .
Main Components of the MACD2 Indicator🧱
The MACD2 indicator consists of three main parts:
- MACD Line: This line is obtained by subtracting two exponential moving averages (EMAs) with different time periods (usually 12 and 26 periods). The MACD line shows the difference between these two moving averages, and its changes indicate changes in the strength and direction of the trend.
- Signal Line: This line is an exponential moving average of the MACD line (usually 9 periods). The signal line acts like a filter for the MACD line, helping traders identify trading signals more accurately. The intersection of the MACD line with the signal line creates buy and sell signals.
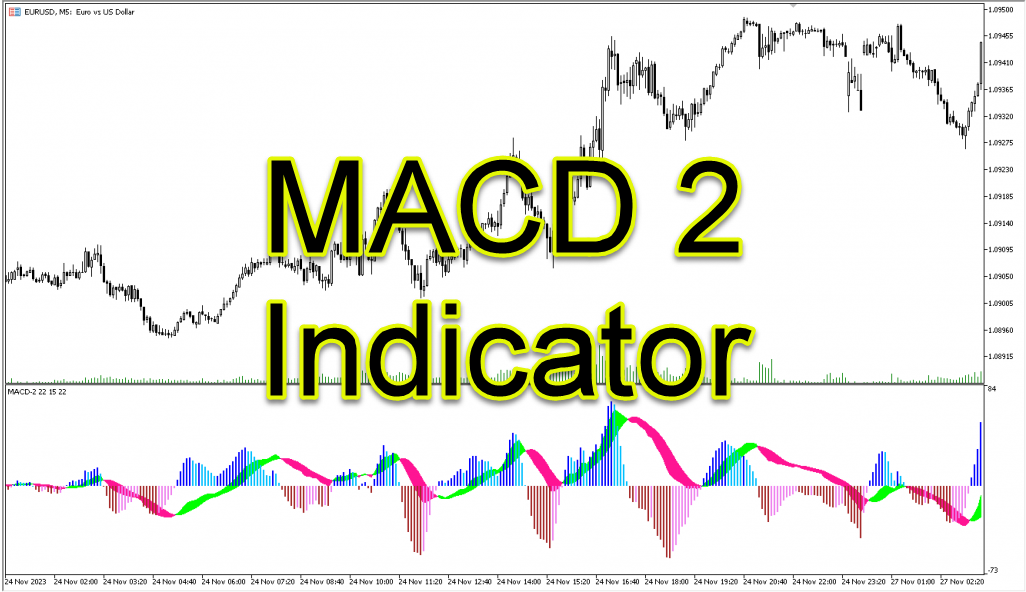
- Histogram: The MACD2 histogram shows the difference between the MACD line and the signal line. The bars of the histogram visually represent the amount of difference between these two lines, helping traders examine the speed and acceleration of trend changes.
Important Features of the MACD2 Indicator✨
- Advanced Customization: One of the most important features of MACD2 is its high customizability. Traders can adjust various indicator parameters, such as the length of the time periods for moving averages, colors, and the style of displaying lines and histograms, based on their needs and trading strategies.
- Multi-Timeframe Display: The MACD2 indicator allows traders to place multiple instances of this indicator with different settings on a single chart. This feature helps traders perform multi-timeframe analyses and gain a more complete view of the market.
- Divergence Identification: MACD2 can help traders identify divergences. Divergences occur when the price of an asset is creating new highs or lows, while the MACD2 indicator does not register new highs or lows. These divergences can be a sign of weakness in the current trend and the potential for a change in direction.
MACD2 Indicator Settings⚙️
After installing the MACD2 indicator, you can customize its settings based on your trading strategy. To access the indicator settings, right-click on the chart and select “Indicators List.” Then select the MACD2 indicator and click the “Edit” button.In the settings window, you can change the following parameters:

Click here to download and install MACD2 Indicator .
- Fast EMA: Length of the fast exponential moving average period (usually 12 periods)
- Slow EMA: Length of the slow exponential moving average period (usually 26 periods)
- Signal SMA: Length of the simple moving average of the signal line (usually 9 periods)
- Colors: Color of the MACD line, signal line, and histogram
- Levels: Horizontal levels to show overbought and oversold areas

Click here to download and install MACD2 Indicator .
Buy and Sell Signals Using MACD2🚦
The MACD2 indicator provides buy and sell signals based on the intersection of the MACD line with the signal line and the color change of the histogram.
Buy Signal:📈
- Bullish Crossover: When the MACD line crosses the signal line from below, a buy signal is issued.
- Histogram Color Change: When the histogram changes color from negative to positive values, another buy signal is confirmed.
- Upward Trend: To further confirm the buy signal, it is better to wait for the formation of a bullish candlestick.
- Stop Loss: Place the stop loss below the previous swing low.
- Take Profit: Determine the take profit based on your desired risk-to-reward ratio (usually 1.5:1 or 2:1).

Click here to download and install MACD2 Indicator .
Sell Signal:📉
- Bearish Crossover: When the MACD line crosses the signal line from above, a sell signal is issued.
- Histogram Color Change: When the histogram changes color from positive to negative values, another sell signal is confirmed.
- Downward Trend: To further confirm the sell signal, it is better to wait for the formation of a bearish candlestick.
- Stop Loss: Place the stop loss above the previous swing high.
- Take Profit: Determine the take profit based on your desired risk-to-reward ratio (usually 1.5:1 or 2:1).

Click here to download and install MACD2 Indicator .
Important Notes When Using MACD2⚠️
- Signal Confirmation: Always confirm MACD2 signals using other indicators and price patterns.
- Risk Management: Proper risk management, including setting stop loss and take profit, is very important for success in trading.
- Suitable Timeframe: Using MACD2 in the 30-minute timeframe can help traders identify short-term price movements more accurately, but using higher timeframes can also help confirm signals and better understand the overall market trend.
- Testing and Practice: Before using MACD2 in real trades, test it on a demo account and familiarize yourself with how it performs in different market conditions.
Disadvantages of Using MACD2 in the 30-Minute Timeframe🚨
- More False Signals: The 30-minute timeframe may generate more false signals compared to higher timeframes.
- Need for More Focus: Traders need more focus to trade on the 30-minute timeframe because price movements are faster and fluctuations are greater.
EMA in MACD2: A Closer Look📈
The exponential moving average (EMA) plays a key role in the performance of MACD2. EMA gives more weight to recent prices, which makes it more sensitive to price changes. This sensitivity is very valuable for short-term trades in the 30-minute timeframe. Understanding the difference between EMA and the simple moving average (SMA) is important. SMA gives equal weight to all prices over a specified time period, while EMA gives more weight to newer prices.

Click here to download and install MACD2 Indicator .
Formula for Calculating the MACD Line🧮
The MACD line is calculated using the following formula:
MACD = EMA(Price, Short Period) - EMA(Price, Long Period)
- EMA (Price, Short Period): Exponential moving average of price with a short time period (usually 12).
- EMA (Price, Long Period): Exponential moving average of price with a long time period (usually 26).
The choice of different time periods has a great impact on the sensitivity of the indicator. Shorter time periods increase sensitivity and generate more signals, while longer time periods provide more stable signals.
Signal Line: Filtering False Signals🔍
The signal line acts as a filter for the MACD line and prevents the creation of false signals. The signal line is an exponential moving average of the MACD line (usually 9 periods). This line helps traders identify trading signals more accurately. Consider how the signal line reacts to changes in the MACD line and the impact of its time period.The histogram shows the difference between the MACD line and the signal line, helping traders assess the speed and acceleration of trend changes. Positive bars indicate an increase in the strength of the upward trend, and negative bars indicate an increase in the strength of the downward trend. The longer the bars of the histogram, the greater the acceleration of the trend.
Leveraging the MACD2 MT5 Indicator for Profitable 30-Minute Forex Trading
The MACD2 MT5 indicator is a powerful tool for technical analysis in the Forex market that can help traders identify trends, trading strength, and entry and exit points. Using this indicator in the 30-minute timeframe can help traders identify short-term price movements more accurately and seize profitable trading opportunities. However, traders should note that no indicator alone can guarantee profit and should always use proper risk management and confirm MACD2 signals with other indicators and price patterns.I hope this guide helps you use the MACD2 MT5 indicator in the best way and have profitable trades!


Post Comment