Grid Indicator MT4 MetaTrader for scalp in Forex Free Download
Introduction to the Grid Indicator 🛠️
The Grid feature in the MetaTrader 4 (MT4) platform might be one of the most underused and overlooked features. However, this feature can be very useful for traders who use specific strategies such as Averaging or Grid Straddling. The Grid Indicator was created to improve and expand the default Grid capabilities in MT4, providing more flexibility for traders.
What is the Grid Indicator? 📊
Premium TradingView account only $20 to buy, click here.
Click here to download and install Grid Indicator .
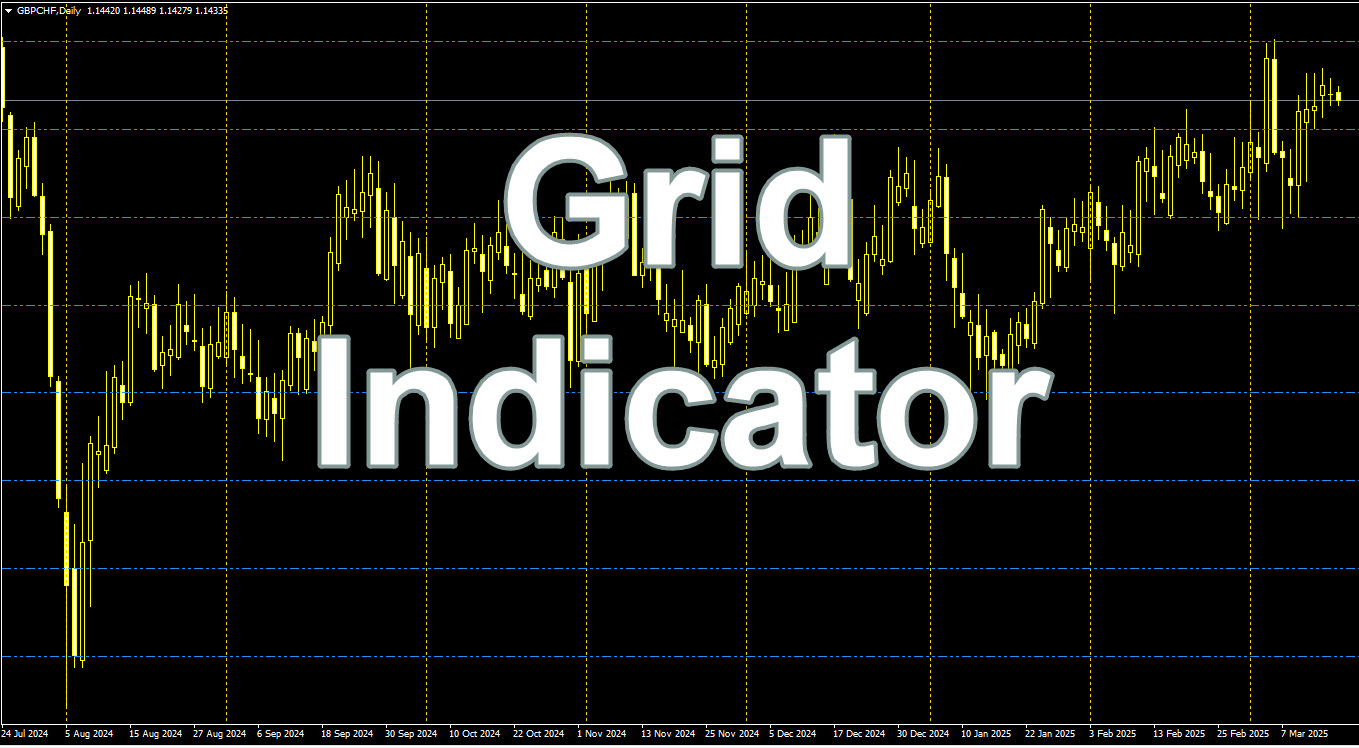
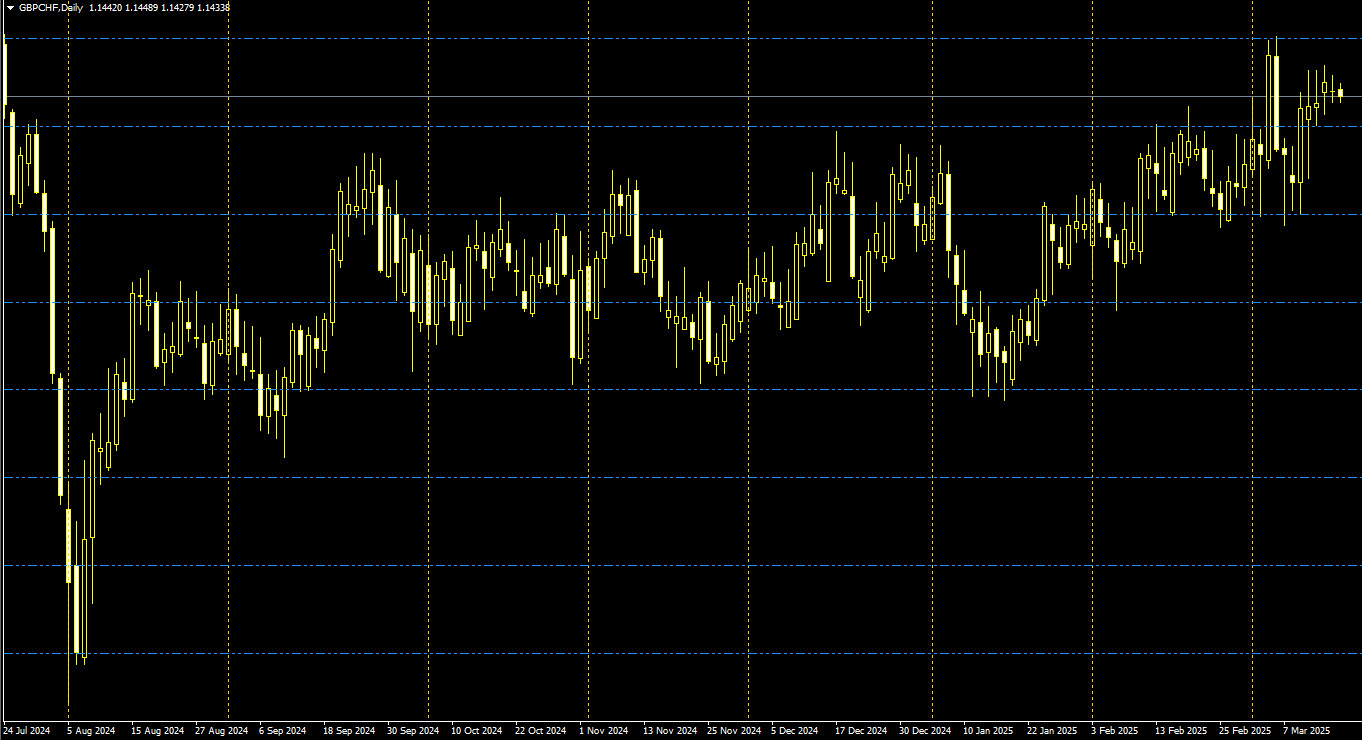
The Grid Indicator is a simple analytical tool that automatically draws a grid on the price chart based on the user’s needs. This indicator draws dotted and dashed horizontal lines with different colors (usually light gray and blue) on the chart. The distance between these horizontal lines depends on the number of points specified by the user in the settings. If no changes are made to the settings, the indicator automatically draws the lines based on the price range available on the chart.
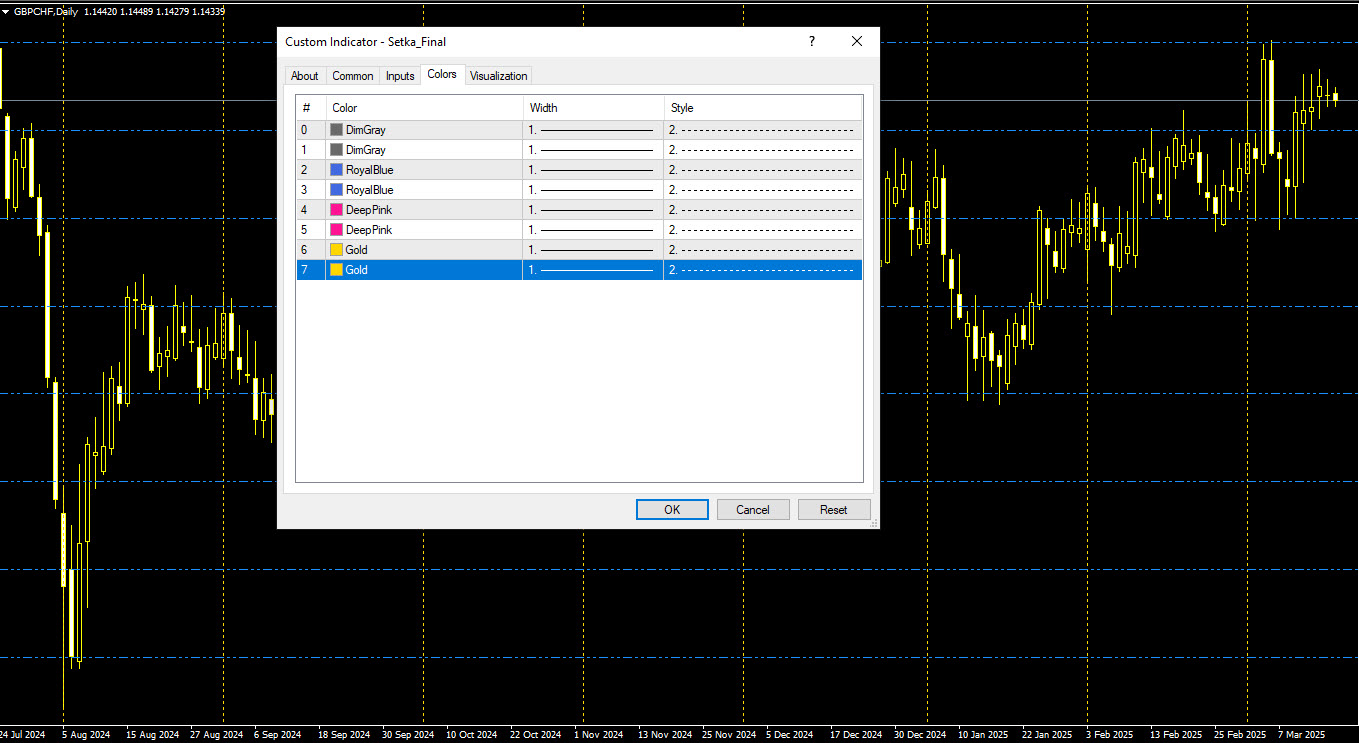
Additionally, this indicator draws dotted vertical lines to separate different time periods (such as days and months) based on the selected timeframe. For example, in a 1-hour chart, the indicator uses the daily timeframe to separate the day periods with a dark pink line and the monthly periods with a golden vertical line.
How the Grid Indicator Works 💡

Click here to download and install Grid Indicator .
The Grid Indicator uses a simple algorithm to draw horizontal and vertical lines. The horizontal lines are based on rounded and adjusted numbers, and their distance is determined by the settings defined by the user. If these settings remain unchanged, the distances are automatically adjusted based on the price range available on the chart.
This indicator also draws vertical lines based on period separations such as days and months. Dark pink vertical lines are used to separate minor periods (e.g., days), while golden lines separate major periods (e.g., months). This feature can be useful for timing analysis and observing mid-to-long-term market trends.
Key Features of the Grid Indicator 🔧
The Grid Indicator has specific features that distinguish it from similar default tools in MT4:
-
Adjustable Horizontal Line Distance: While the default MT4 Grid tool sets the distance between lines automatically, the Grid Indicator allows the user to change the distance between horizontal lines according to their needs. These distances are usually measured in “points,” which can be adjusted for greater precision.
-
Time Period Separation: In this indicator, vertical lines clearly indicate not only minor periods (such as daily) but also major periods (such as monthly). This distinction helps analysts to see market trends with greater clarity.
-
Automatic Adjustment Based on the Price Chart: If the user does not make any changes to the settings, the indicator automatically draws the lines based on the price range available on the chart. This feature eliminates the need for the user to manually enter values for the distances.
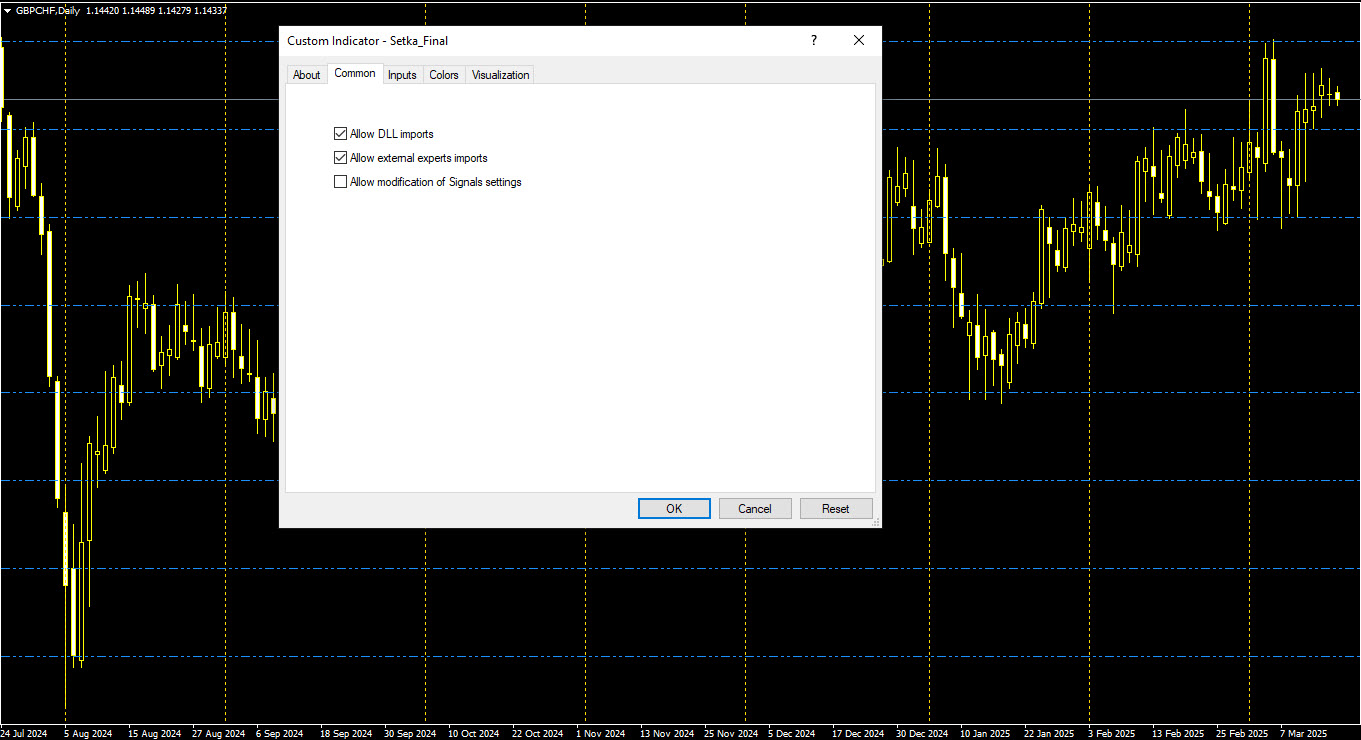
How to Use the Grid Indicator in MT4 📈
Using the Grid Indicator is very simple. This indicator has only one adjustable setting, which is the distance between the horizontal lines. This setting is usually specified in “points,” but you can change it to suit your needs.
To set up this indicator, simply enter the desired distance between each horizontal line in pips. For example, if you want the distance between the horizontal lines to be 20 pips, enter the number 200 (which equals 200 points). This allows you to create a grid that fits your trading strategies.
Grid Indicator vs. Default Grid in MT4 ⚖️
Click here to download and install Grid Indicator .
In MetaTrader 4, the default Grid feature draws horizontal lines on the chart. However, the Grid Indicator offers additional and customizable features that are not present in the default version. For example, with the default Grid, you cannot change the distance between the horizontal lines, but the Grid Indicator allows this customization. This difference makes the Grid Indicator more useful and practical for many traders.
Comparison with Period Separators in MT4 ⏳
Period Separators in MT4 are one of the main tools for separating time periods on charts. These vertical lines are usually used to separate days or weeks. However, the Grid Indicator not only does this but also uses color differences to distinguish between different time periods. For example, daily periods are marked with a pink line, and monthly periods are marked with a golden line. This more precise separation makes trend analysis easier for traders.
The Grid Indicator is a simple and useful tool for traders who are looking for a more advanced grid tool than the default one in MT4. With adjustable line distances and more precise time period separation, this indicator can be very helpful for various trading strategies, especially grid and averaging strategies. Additionally, its simple interface and flexible settings make it easy to use for traders of any level.
Overall, using the Grid Indicator can help traders make more accurate analyses of charts and market trends, leading to better trading decisions.
Post Comment