Ichimoku Indicator MT4 – MetaTrader Free Download

Download Ichimoku Indicator for MetaTrader 4 🌟 – The Ichimoku Indicator is one of the most powerful technical analysis tools available for traders. Originally developed by Japanese journalist Goichi Hosoda in the late 1930s, this indicator is widely used to analyze market trends, identify potential reversals, and determine support and resistance levels. Unlike traditional moving averages, Ichimoku provides a comprehensive view of market momentum and trend strength in a single glance.
In this detailed guide, we will explore everything about the Ichimoku Indicator in MetaTrader 4 (MT4), including its components, how to interpret signals, and how to use it effectively for trading strategies.
Premium TradingView account only $20 to buy, click here.
Click here to download and install the Ichimoku Indicator For MT4! 
Understanding the Components of Ichimoku Indicator

Ichimoku consists of five key components, each serving a specific purpose:
1. Tenkan-sen (Conversion Line) 📊
- Represented as a red line.
- Calculated as the average of the highest high and lowest low over the past 9 periods.
- Acts as a short-term trend indicator and a support/resistance level.
2. Kijun-sen (Base Line) 🔄
- Represented as a blue line.
- Calculated as the average of the highest high and lowest low over the past 26 periods.
- Provides a medium-term trend signal.
- If the price is above Kijun-sen, the trend is bullish; if below, it is bearish.
3. Senkou Span A (Leading Span A) 🔄
- Calculated as the average of the Tenkan-sen and Kijun-sen, plotted 26 periods ahead.
- Forms part of the Ichimoku Cloud (Kumo).
4. Senkou Span B (Leading Span B) ✨
- Calculated as the average of the highest high and lowest low over the past 52 periods, plotted 26 periods ahead.
- The space between Senkou Span A and B forms the Kumo (Cloud).
- If Senkou Span A is above Span B, the market is bullish; if below, it is bearish.
5. Chikou Span (Lagging Span) 🔄
- Represented as a green line.
- The current closing price, plotted 26 periods in the past.
- Confirms trend strength; if it is above the price, it signals bullish strength, and if below, bearish strength.
How to Read Ichimoku Signals
The Ichimoku system provides multiple trading signals based on crossovers, price position relative to the cloud, and the interaction of different lines.
1. Trend Identification
- If the price is above the cloud, the trend is bullish.
- If the price is below the cloud, the trend is bearish.
- If the price is inside the cloud, the market is consolidating and lacks a clear trend.
2. Entry and Exit Signals
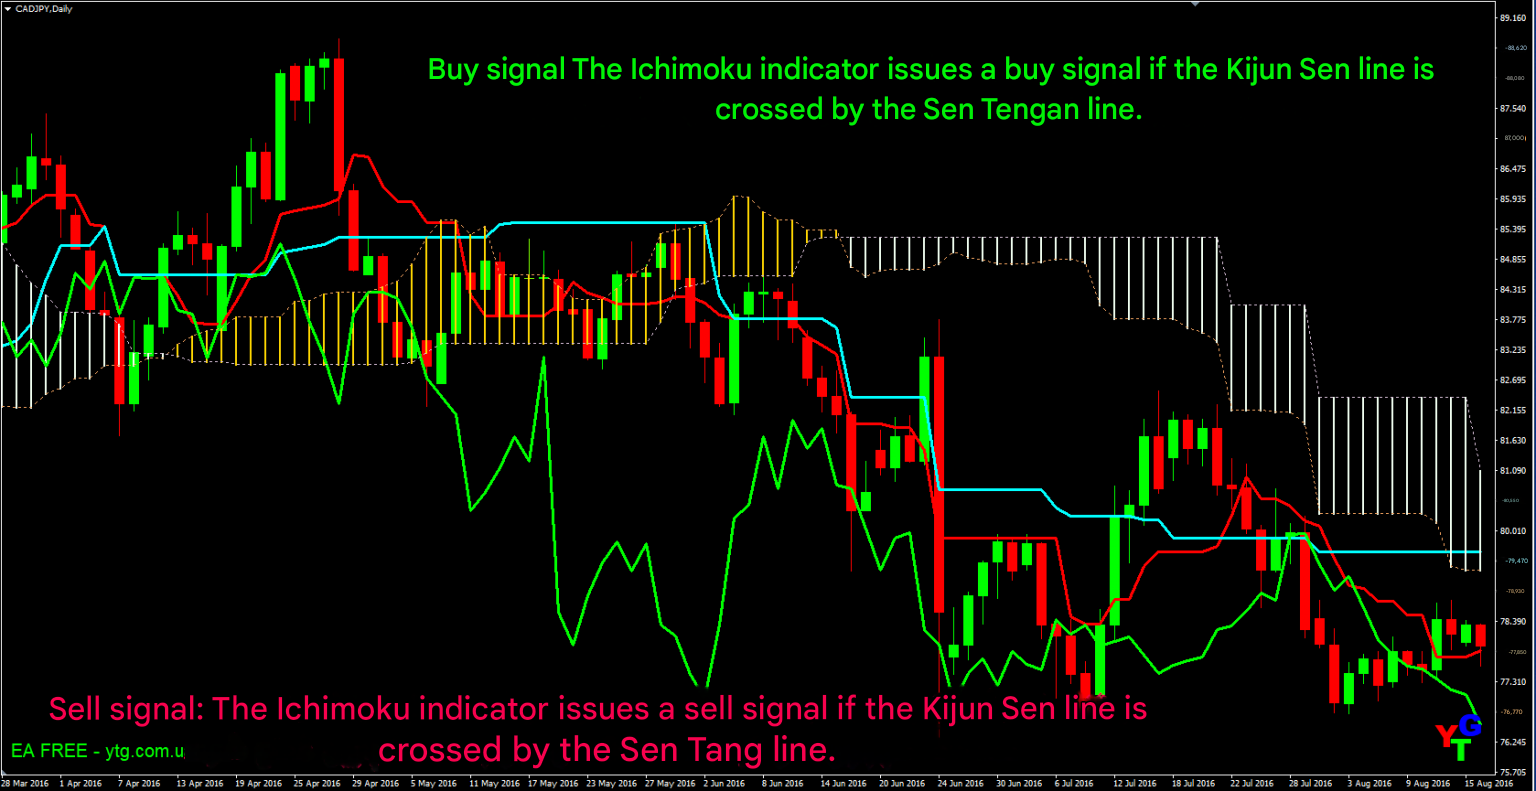
Bullish Entry Signal 🏆
- The Tenkan-sen crosses above the Kijun-sen.
- Price is above the Ichimoku cloud.
- Chikou Span is above the price.
Bearish Entry Signal 📉
- The Tenkan-sen crosses below the Kijun-sen.
- Price is below the Ichimoku cloud.
- Chikou Span is below the price.
3. Support and Resistance Levels
- The Ichimoku Cloud (Kumo) acts as a dynamic support and resistance.
- A thick cloud indicates strong support or resistance.
- A thin cloud suggests weak support or resistance.

Ichimoku Trading Strategies
1. Trend Following Strategy
- Buy when price is above the cloud and the Tenkan-sen crosses above Kijun-sen.
- Sell when price is below the cloud and the Tenkan-sen crosses below Kijun-sen.
2. Kumo Breakout Strategy 📢
- If the price breaks above the cloud, it confirms a bullish breakout.
- If the price breaks below the cloud, it signals a bearish breakdown.
3. Chikou Span Confirmation
- A bullish trend is confirmed if the Chikou Span is above the price.
- A bearish trend is confirmed if the Chikou Span is below the price.
4. Ichimoku with Other Indicators
Ichimoku can be combined with:
- RSI (Relative Strength Index) for overbought/oversold confirmation.
- MACD (Moving Average Convergence Divergence) for additional trend confirmation.
- Bollinger Bands to identify volatility levels.
Indicator Setting


Click here to download and install the Ichimoku Indicator For MT4!
Advantages of Using Ichimoku in MT4
🌟 All-in-One Indicator – Provides support/resistance, momentum, and trend signals. 🔄 Works in All Timeframes – Can be used for scalping, day trading, and swing trading. 📈 Reliable Trend Identification – Clearly distinguishes bullish, bearish, and neutral trends. 💡 Easy Visualization – Color-coded components help traders make quick decisions.
Conclusion
The Ichimoku Indicator is a powerful and versatile tool that can significantly enhance your trading strategy in MetaTrader 4. By understanding its components, recognizing key trading signals, and applying different strategies, traders can make more informed and profitable decisions.
Start using the Ichimoku Indicator in MT4 today and take your trading to the next level! 🚀


Post Comment