FX Fish Indicator MT4 – MetaTrader Free Download
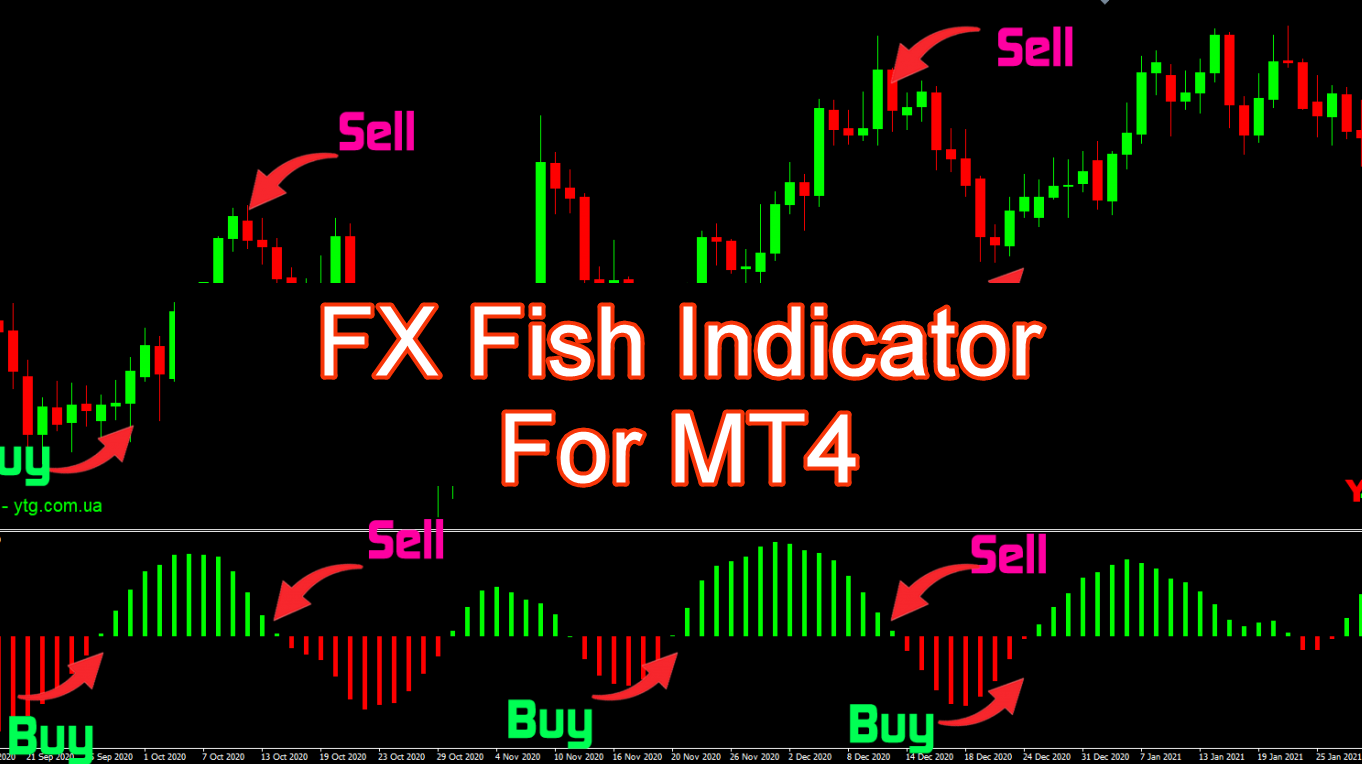
Download FX Fish Indicator For MT4 – In the complex world of financial markets, recognizing entry and exit points, as well as analyzing market trends’ strength, are among the most important skills for any trader. One of the most valuable tools for market analysis is indicators, which can help traders make more informed decisions. In this article, we will explore the FX Fish Indicator, specifically designed to identify entry and exit points and measure the market trend strength using a histogram in MetaTrader 4.
What is the FX Fish Indicator?
The FX Fish Indicator is a powerful analytical tool used to identify entry and exit points in the market, as well as gauge the strength of the market trend. The indicator uses a green and red histogram to display price fluctuations around its zero midpoint. One of its unique features is measuring the ratio between the total positive increases and the total negative increases within a defined period. This allows traders to identify bullish and bearish trends, providing crucial insights for decision-making.
Premium TradingView account only $20 to buy, click here.
Key Features of the FX Fish Indicator
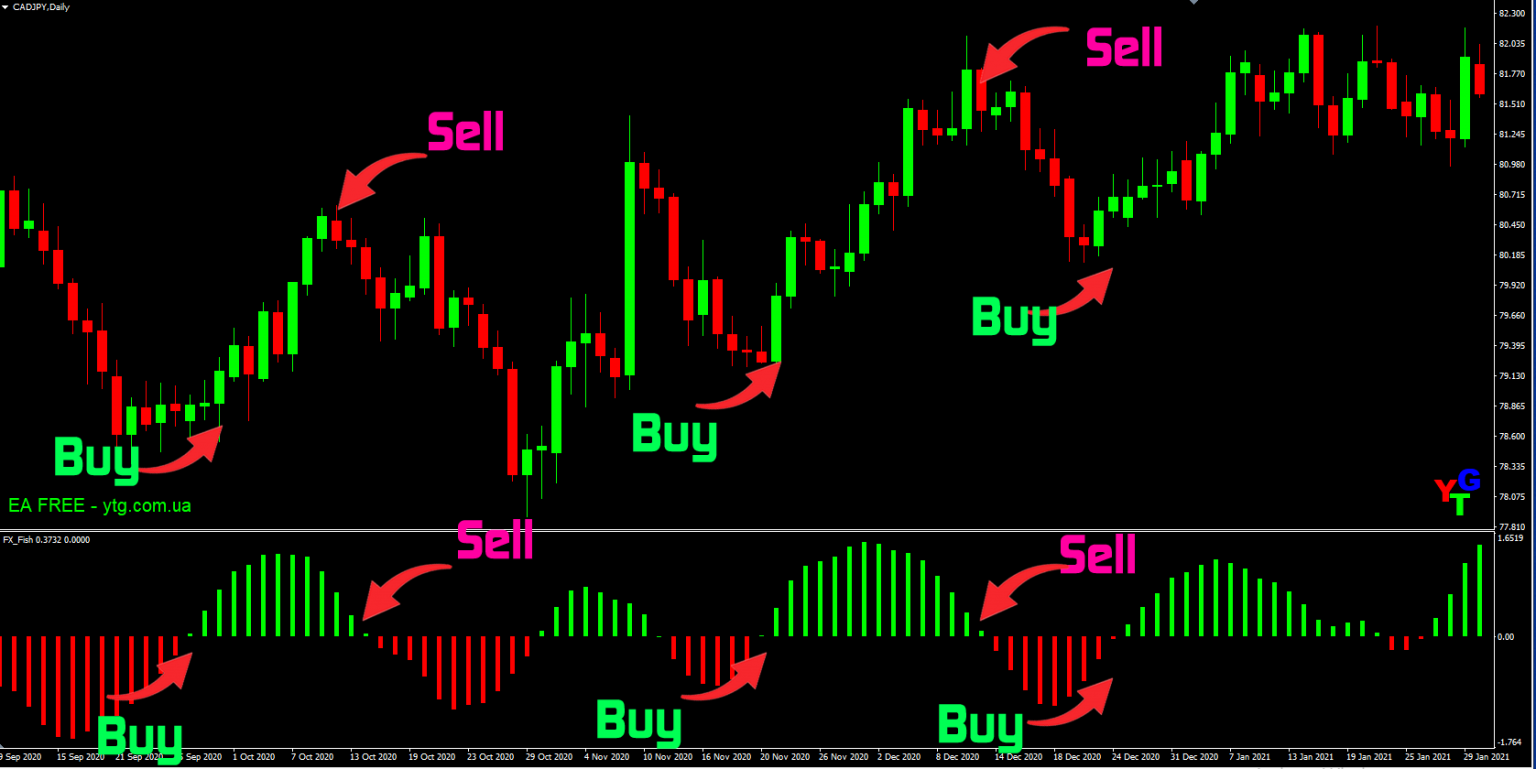
- Identifying Entry and Exit Points: The FX Fish Indicator helps traders easily spot entry and exit points by changing the color of its histogram.
- Green and Red Histogram: The histogram of this indicator changes color to green for an upward trend and red for a downward trend.
- Trend Strength Analysis: The FX Fish Indicator helps traders assess the strength of market trends based on how quickly the histogram changes.
- Works Across All Time Frames: This indicator can be used on all time frames, but it works best on larger time frames such as 4-hour and daily charts.
How to Use the FX Fish Indicator?
The FX Fish Indicator automatically displays entry and exit points for you. Here’s how to use it:
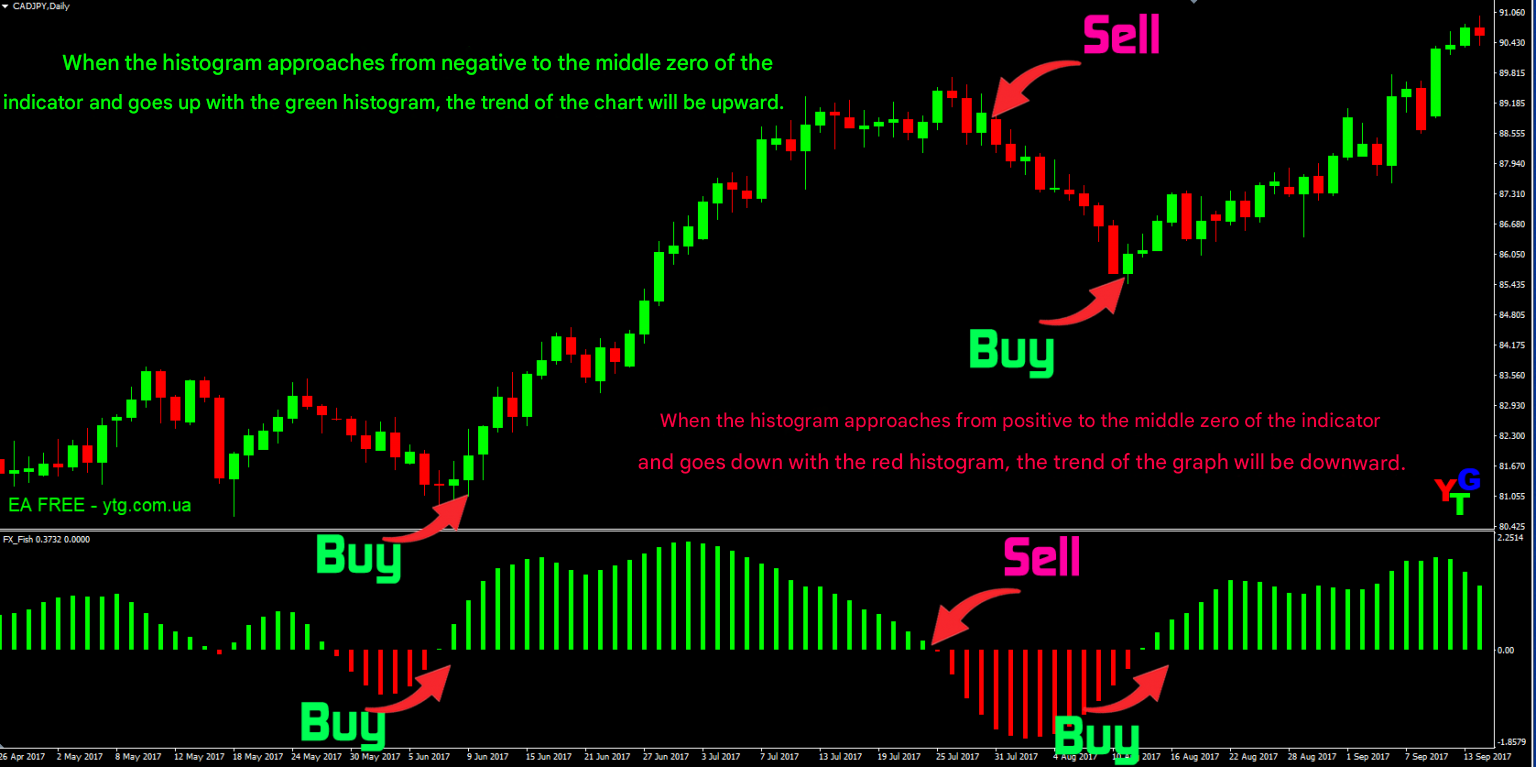
- Entry Signal: When the histogram crosses above the zero line and moves upward, it turns green. This is the signal for entering the market, indicating the start of a bullish trend 📈.
- Exit Signal: When the histogram crosses below the zero line and moves downward, it turns red. This is the signal for exiting the market, indicating the beginning of a bearish trend 📉.
Click here to download and install the FX Fish Indicator For MT4! 
Signal Generation with the FX Fish Indicator
In this section, we will examine the different signals generated by the FX Fish Indicator.
Entry Signal (Bullish):
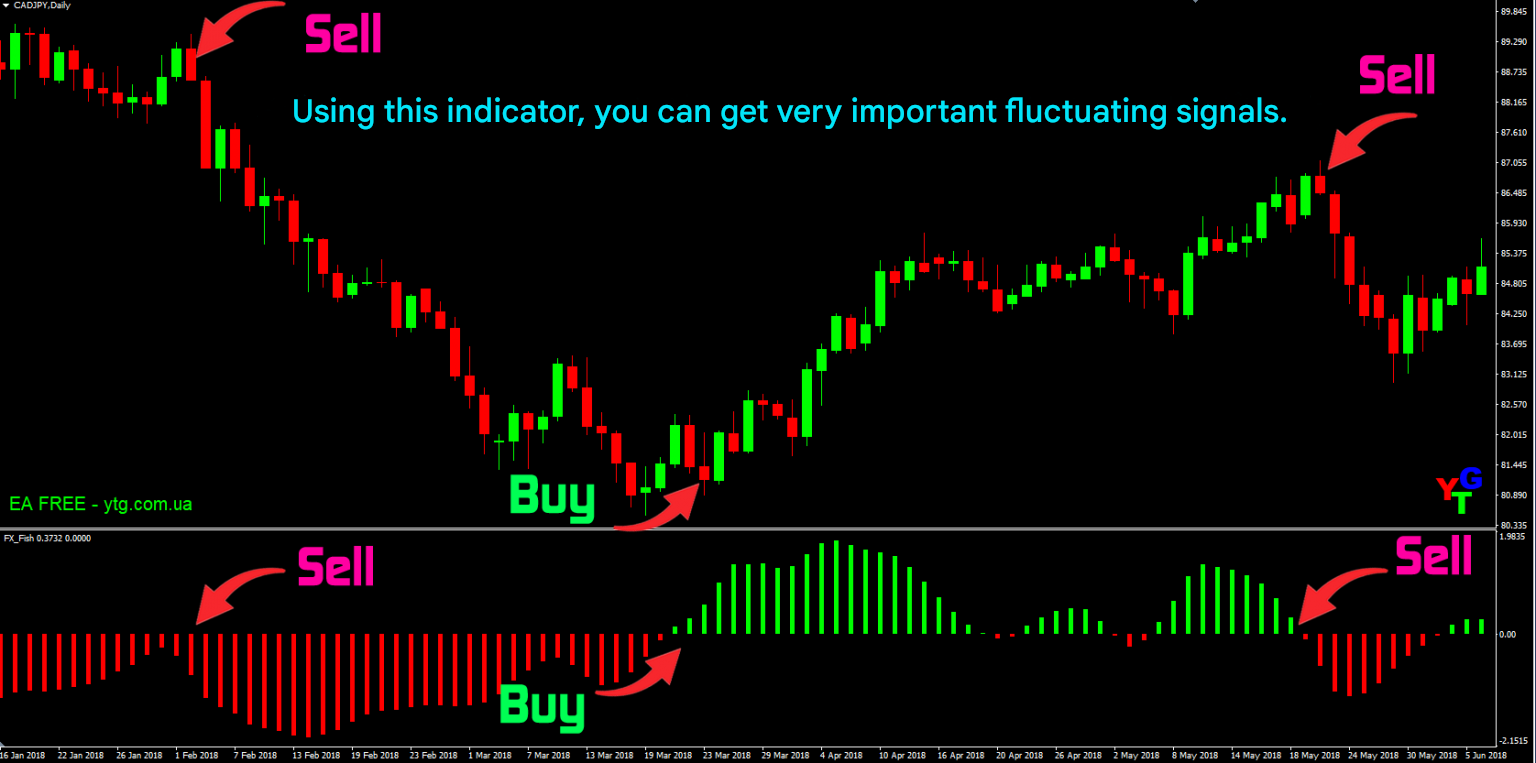
When the market’s trend changes from bearish to bullish, the FX Fish Indicator also switches direction. This means that the histogram changes from red to green and starts moving upward. This signal suggests the beginning of a bullish trend, and traders should consider entering the market 💰.
Exit Signal (Bearish):
When the market’s trend shifts from bullish to bearish, the FX Fish Indicator also changes direction. The histogram turns from green to red and moves downward. This signal indicates the beginning of a bearish trend, suggesting that traders should exit the market ⬆️➡️⬇️.
How to Identify Market Strength with the FX Fish Indicator
Beyond identifying entry and exit points, the FX Fish Indicator also helps you assess the strength of the market trend. Here’s how:
- Bullish Strength: When the histogram rapidly changes from red to green, this indicates a powerful bullish trend 🚀. A rapid shift suggests that the market is gaining strength and the upward momentum is likely to continue.
- Bearish Strength: Similarly, when the histogram quickly changes from green to red, it signals a strong bearish trend 📉. A fast move from bullish to bearish suggests that the market is losing strength and might decline rapidly.
Divergence and Using the FX Fish Indicator
The FX Fish Indicator is also useful for spotting divergences, which can be a critical signal for future market movements. Here’s how it works:
- Positive Divergence: This occurs when the price moves lower, but the histogram moves upward. This suggests a potential reversal to the upside, indicating that the market might soon shift to a bullish trend 🔼.
- Negative Divergence: Conversely, negative divergence happens when the price rises, but the histogram moves downward. This is a sign that the market might be preparing for a downturn, signaling the start of a bearish trend 🔽.
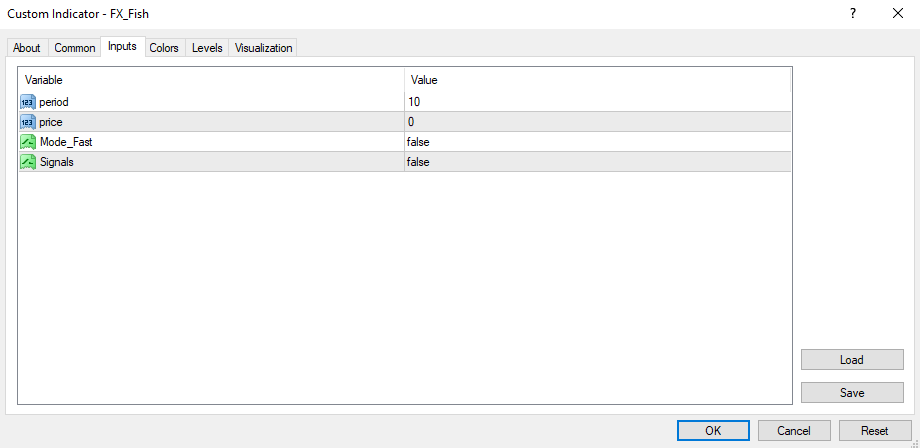
Customizing the FX Fish Indicator Settings
The FX Fish Indicator comes with excellent default settings, but it also offers flexibility for customization if desired:
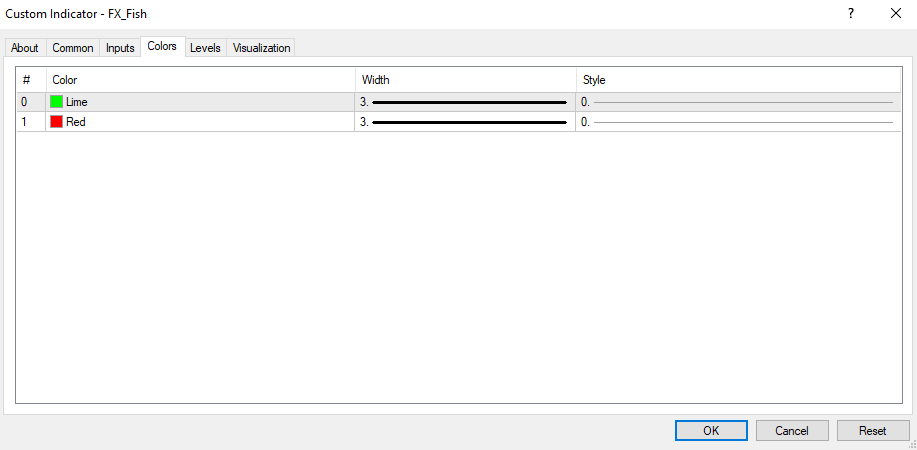
- Color Settings: To improve clarity, you can change the colors of the histogram. Selecting the right colors can help you spot signals more easily.
- Histogram Size Settings: If you wish to adjust the size of the histograms for better visual clarity, you can modify the corresponding settings as per your preferences.
Click here to download and install the FX Fish Indicator For MT4!
Why Should You Use the FX Fish Indicator?
The FX Fish Indicator offers several key advantages for traders:
- User-Friendly and Simple: The indicator is easy to use and quickly displays entry and exit signals, making it accessible for both novice and experienced traders 💡.
- Trend Strength Analysis: It helps traders identify strong bullish or bearish trends, allowing them to capitalize on powerful market movements.
- Works Across All Time Frames: Whether you’re conducting short-term or long-term analysis, the FX Fish Indicator can be applied to all time frames, making it versatile and useful for different trading styles ⏱️.
Additional Tips for Maximizing the FX Fish Indicator
To make the most out of the FX Fish Indicator, here are some advanced tips and tricks:
- Combine with Other Indicators: For even more accurate signals, consider combining the FX Fish Indicator with other technical indicators, such as RSI or Moving Averages, for comprehensive market analysis 🛠️.
- Use on Higher Time Frames for Better Accuracy: While it works on all time frames, the indicator is especially reliable on higher time frames (e.g., 4-hour or daily charts). Longer time frames provide better market trend clarity and reduce noise 📊.
- Observe Market Volatility: Keep an eye on market volatility when using the FX Fish Indicator. Volatile markets can sometimes generate false signals, so it’s essential to combine the indicator with sound risk management techniques ⚖️.
Conclusion
The FX Fish Indicator is a powerful and helpful tool for identifying market entry and exit points as well as analyzing the strength of market trends. By utilizing the green and red histogram and measuring its changes, this indicator provides accurate signals for making trading decisions. For best results, it can be used alongside other indicators, allowing traders to gather additional insights and take advantage of market fluctuations.
Whether you’re a short-term or long-term trader, the FX Fish Indicator can help enhance your trading strategy and improve decision-making. With its user-friendly interface, clear signals, and versatility across all time frames, it’s a must-have tool in any trader’s toolkit 💼.


Post Comment